
Lightspeed sits on a goldmine of restaurant data. We turned raw data into a competitive intelligence tool — giving operators real benchmarks and insights to act on, not just numbers to stare at. In 2 months we went from a mockup to an MVP product critical to merchant workflow.
Business objectives
Establish market lead
Compete with Toast, competitor in USA
Monetize data pool across the globe
Create upsell value
Product outcomes
Sold 79 Pro packages in Q3, Q4 2025
Sales enablement tool at trade shows
Activated in 14 markets within 6 months
New revenue stream from existing data
Design outcomes
+18% engagement in reporting tools
Improved data & insight comprehension
New patterns used by multiple teams
UXR established to guide future iterations
Team’s mission: Make an insightful tool and find market fit in 3 months
The team was set up to identify value and deliver an MVP to be the market leader.

Anurag
Design lead

Dominique
Product Designer

Stuart Miller
Product Manager

Peter
Lead Engineer

Liz
Director of Product

Ivana
Lead data scientist
Key insights that moved the team forward
Stories from customers helped us position Benchmarks as a competitive tool, an upgrade to Lightspeed's base experience.
Guessing position in the market
Decision makers need a lot of information to understand where they stand in the market and how they could stay competitive.
Estimating growth levers
Knowing how the business can be improved by focusing on performance areas. It takes a lot of work to know where to act.
Diner behaviors
Diner preferences and habits can be misjudged or remain loose estimates. Which items bring people back?
Controlling menu pricing decisions
Fear of changing prices and not knowing what comparable restaurants charge. Not taking full control of the menu.
Workshop with product & eng leaders
This workshop was key to positioning the value proposition of this tool
My food & bev split vs the market to enhance revenue
My pricing of food & bev categories vs market to aid pricing strategy
Same KPIs I use vs market to enable apple to apple comparisons
My Hourly activity vs market to assess opening hours
My sales vs market in a min/max range to enable quick study
To be able to log changes and track them across time
Value prop workshop was pivotal to how we shaped the tool
Project mission
Make Lightspeed the go-to source for competitive intelligence, turning raw restaurant data into decisions operators can act on today.
MVP Release
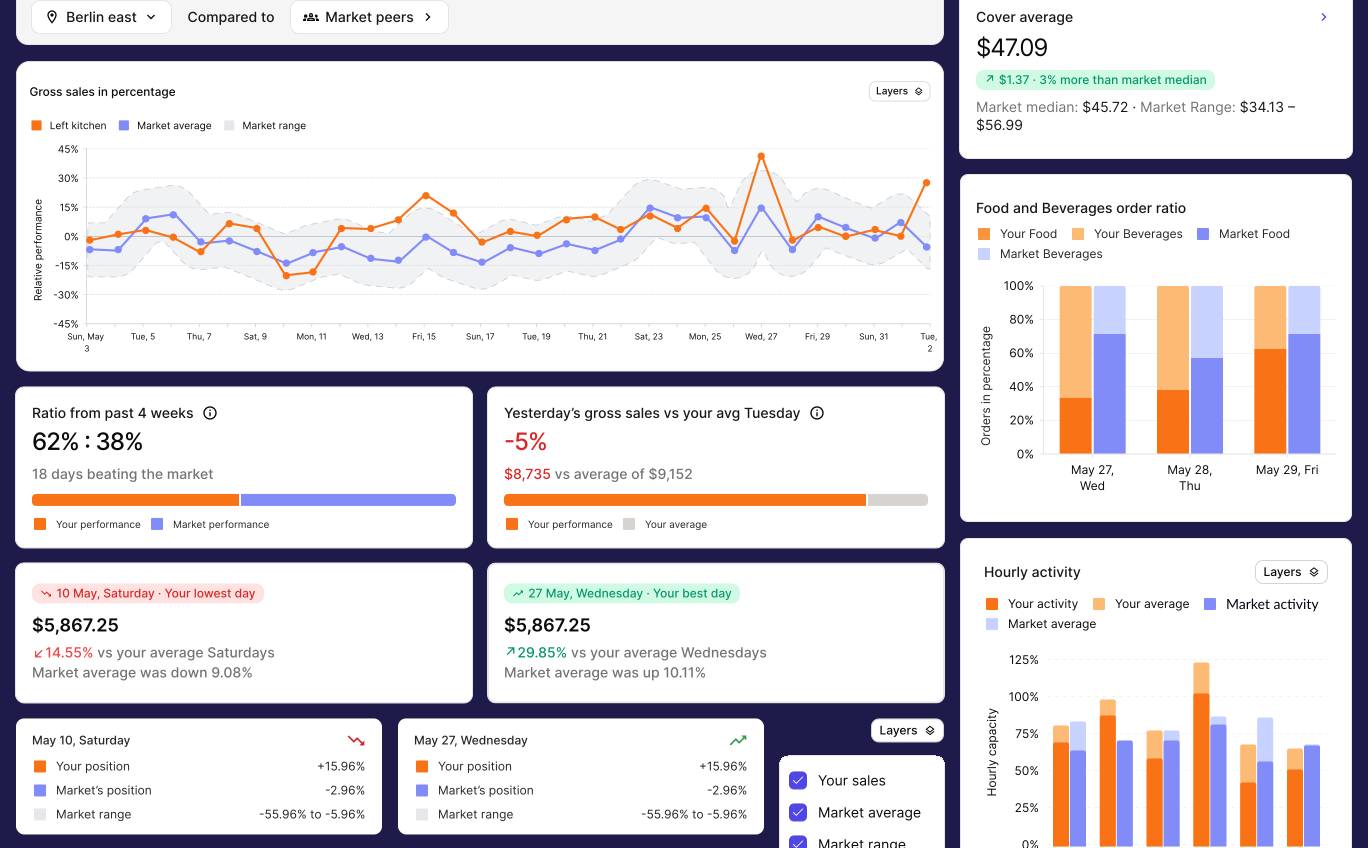
Key performance metrics vs Market
Indicators that can be leveraged
Measure traffic and guest spending
Understanding anchoring metrics to define position in the market
Performance vs Market over time
To locate performance patterns + good and bad days
Assess position in the market range
Market range and your position determined by a rolling average
Food & Beverages Split vs Market
Menu performance and dining preferences
Food & beverages sales
Assessing whether you sold more beverages vs the market, as bevs have a higher margin in the business
Hourly capacity
Measure busy-ness and cover capacity
Top hours and improvement areas
Reviewing peak capacity and identifying gaps to nudge staff performance or other levers
Edit your profile
To personalise and get relevant benchmarks
Relevant benchmarks for your business
Set up your profile so benchmarks reflect your restaurant type and location.
User feedback
Users valued insights about their neighborhood
Engagement was up. We measure this by measuring downloads, page visits, CSAT and qualitative data.

We will use this when we open a new location, it will come handy to strategically price items

Need this for all locations in one view! Will help us gauge performance across the group

We need this in our inbox every month so we can keep tabs on performance without a laptop
Product & engineering roadmap
Adding menu & item insights to zoom-in
Demo product with product marketers
Increasing data pool and confidence
Building new APIs for Agentic chat surfaces
Design roadmap
Adding a multi-location view and setting up emails
Connective tissue between basic & paid modules
Discovering user stories to impact decision making
Scaling data design system across org
Learnings for design
Operators make better real-world decisions when they have context beyond their own four walls.
Simplification is paramount
Guess work is friction, friction is undesirable. Value of a product is lost if it comes with a user's manual.
Insight > fancy charts
Insights tell stories, charts need to be deciphered and in some cases can become noise on the screen.
Feeling in Control
If people don't feel they are in control, any interface will only stand in their way, and users will seek control elsewhere.